50% of schools in EduQuality show improvement in self-assessed education quality

When Ms. Levina Robert and her husband started Rol International School in Tanzania in 2014, the only learners were two twin brothers. Over the next three years the school grew exponentially and now boasts two campuses in Mbweni and Mbezi, with over one hundred enrolled students.
Ms. Robert remembers that she was eager to attend the EduQuality program offered by Opportunity EduFinance. Today, Ms. Robert is an active school partner in the program and says she has improved her strategic planning skills and applied the Pathways to Excellence (P2E) guidance on quality to their school. Recognizing a lack of ‘good schools’ in her area, Ms. Robert explains that she is focusing on adopting teaching strategies and models that are effective in improving students’ learning.

EduQuality, a program of Opportunity EduFinance, works to help school leaders like Ms. Robert to continue building their strategic planning skills for school improvement, institutionalizing an iterative improvement process that will be sustained beyond the three-year program.
In the program, school leaders complete annual school self-assessments using Pathways to Excellence, a guide developed by Opportunity EduFinance to self-diagnose the quality of education at a school across 18 domains. The P2E guide’s 18 domains are organized under three areas: school culture, school management, and teaching and learning.
Using the results of their school self-assessment, school leaders then work with stakeholders in their school community – including teachers, parents and community members - to create a school development plan to prioritize areas for improvement. Leaders are encouraged to target 2-5 areas for improvement each year using the action points and support resources outlined in P2E and supplemental materials.
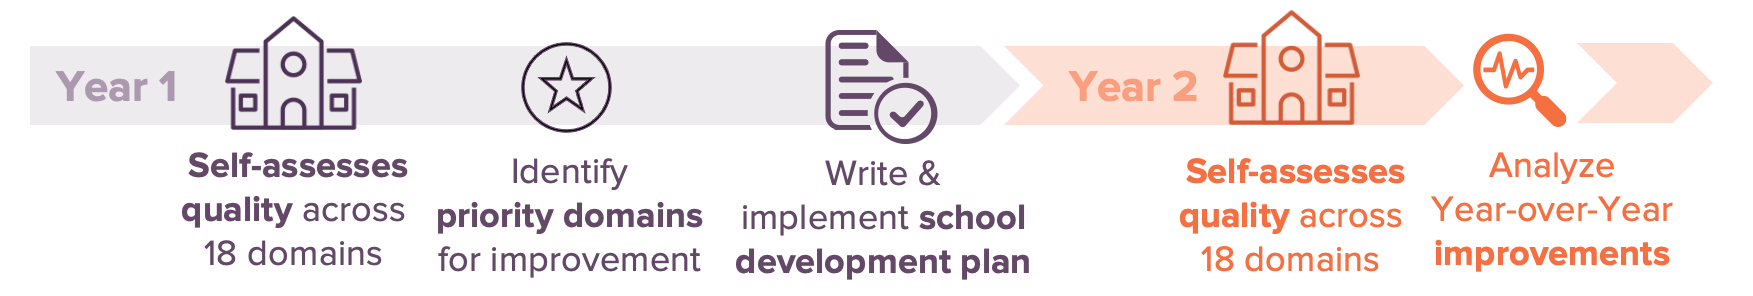
In this blog we examine recent data which shows how school leaders like Ms. Robert have been measuring their own school quality improvements and developing plans to continue their journey toward educational excellence.
ARE EDUQUALITY SCHOOLS IMPROVING EDUCATIONAL QUALITY?
Yes. Analysis from two years of data found 50% of schools reported quality improvements and a further 36% remained stable year-over-year

KEY FINDING 1. Improvements were relatively consistent across all 3 areas of education quality
Of the three Pathways to Excellence areas of quality, Teaching & Learning had a slightly higher percentage of improving or stable schools, and an average score of 2.9 in Year 2. However, overall improvements were relatively consistent across the three areas.

Pathways to Excellence Annual School Self-Assessments
The Pathways to Excellence tool groups 18 education quality domains under 3 areas: school culture, school management, and teaching & learning. The diagnostic tool outlines clear criteria under four (4) levels of quality for each domain, with Level 4 representing excellence. This enables school leader to review and mark the criteria that best describes their school, and then select the level (score) that is most aligned with their school’s quality in each domain.
KEY FINDING 2. Between 42% - 56% of schools improved quality across each of the 18 domains.
The domains with the largest percentage of schools reporting improved scores were Parent and Community Engagement (56%) and Learner-Centred Teaching and Learning (54%).
The domains with the lowest rate of improving scores are Inclusion and Special Educational Needs (42%) and Finance and Business Management (43%).

KEY FINDING 3. Schools are not exclusively selecting the lowest scoring domains in their School Development Plans.
Analysis found that 19% of schools chose to focus on their three domains that needed the most improvement (i.e. lowest school self-assessment scores), while 18% of schools focused on the three domains that had the highest scores across the 18 domains. Across all schools, the most selected domains were Behaviour Management (21%), Child Protection (11%), and Clean and Safe Environment for Learning (10%).
KEY FINDING 4. Domains selected for the School Development Plan were more likely to improve in quality.
School self-assessment scores improved year-over-year across most domains, but there was a notable advantage to selecting any of the domains as a target for the School Development Plan.
Domains that had the highest Year 1 school self-assessment scores also saw a higher proportion of schools (76-85%) achieve their target next level in quality when included in their school development plan. While domains with the lowest Year 1 self-assessment scores had a smaller proportion of schools achieving their target next level in quality when included in a school development plan - between 44-68% - there were still significant improvements.

Reflections & Context
After the M&E Team completed this analysis, the EduQuality team reflected on the findings and considered other factors that may influence school priorities for improvement beyond their quality scores. Through this reflection session, three key considerations emerged:
• Immediate Need. When schools emerged from COVID-19 forced closures, many were looking at domains to help them reopen, including new safety requirements for the school.
• School Development Plan Lead. Plans driven by the Head Teacher rather than school owner may focus more on domains not requiring significant budget to implement.
• School Interest. Schools with a quality score of 2-3 for a domain likely already have decent systems in place and may find it easier to focus on further improvements in those domains
This Key Insight is the first in our Sustainable Schools Learning Series. Read the full Key Insight, and watch for upcoming publications in the series here.